How to analyse Futures using TradingView and COT data
Written by Arne in trading , tagged with COT, TradingView
Overview
If you’re looking to get a deeper insight into futures markets, combining a trading platform like TradingView with Commitments of Traders (COT) data can become a game-changer. When you add COT data into the mix, you get a weekly snapshot of the positions held by commercial and non-commercial traders, giving you a clearer picture of market sentiment.
Commitment of Traders Index
The COT reports for futures-only Commitments of Traders and for Futures and Options Combined Commitments of Traders are collected on Tuesdays and published every Friday at 3:30 p.m. Eastern time. The raw data is available free of charge on the Commodity Futures Trading Commission (CFTC) website.
To get a better understanding on which side the smart money (producers, commercials) are trading on, I look at the COT index. The COT index is calculated using the following formula:
- $a$ = net position current week
- $b$ = minimum net position of last n weeks
- $c$ = maximum net positions of last n weeks
- $n$ = period of 26 weeks
The COT index ranges from 0 to 100%. Extreme values are areas below 25% and above 75%. When the index reaches 0% or 100%, it means that the market participant has the most extreme net short or net long position in the last 26 weeks. Readings below 25% are considered as a short sentiment and readings above 75% are considered long sentiment. However the COT index is not a timing tool. It only shows the overall market sentiment of the smart money in relation over the past 26 weeks.
Disaggregated and Financials
COT reports are divided into two segments. The disaggregated reports consist of grains, energy, metals, livestock and dairy, and softs. The financial traders reports consist of currencies, financials and indices.
TradingView Indicator
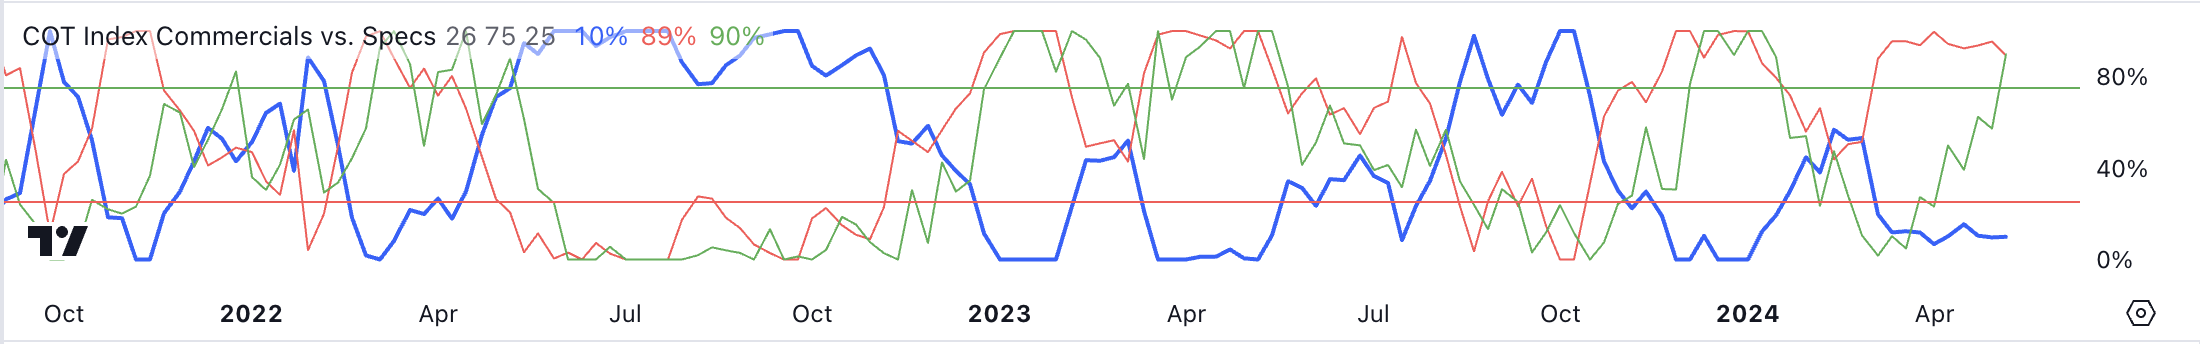
I’ve created a COT Index Commercials vs. Specs indicator for TradingView. You can see it in the screenshot below, which shows three lines (blue, red and green). The blue line represents the commercials that I recommend following. The red line is the large speculators and the green line is the small speculators.
To set up the indicator on your chart, simply switch to the weekly time frame and open the Indicators menu. Search for the term “COT Index Commercials vs Specs” by “SystematicFutures”. Or simply click on this link https://www.tradingview.com/script/fL1GDf2M-COT-Index-Commercials-vs-large-and-small-Speculators/
You can customise the colours, the upper and lower thresholds, which lines are displayed and whether the extremes are highlighted.
Looking for Entries
A simple strategy is to use the COT index as your market sentiment on the weekly chart and on lower time frames such as the daily or 4 hour chart you would look for your entry setup.
On the weekly chart of the gold futures (GC1!) you can see that the commercials are short with a COT index reading of 10% and the large speculators are long with a reading of 89%.
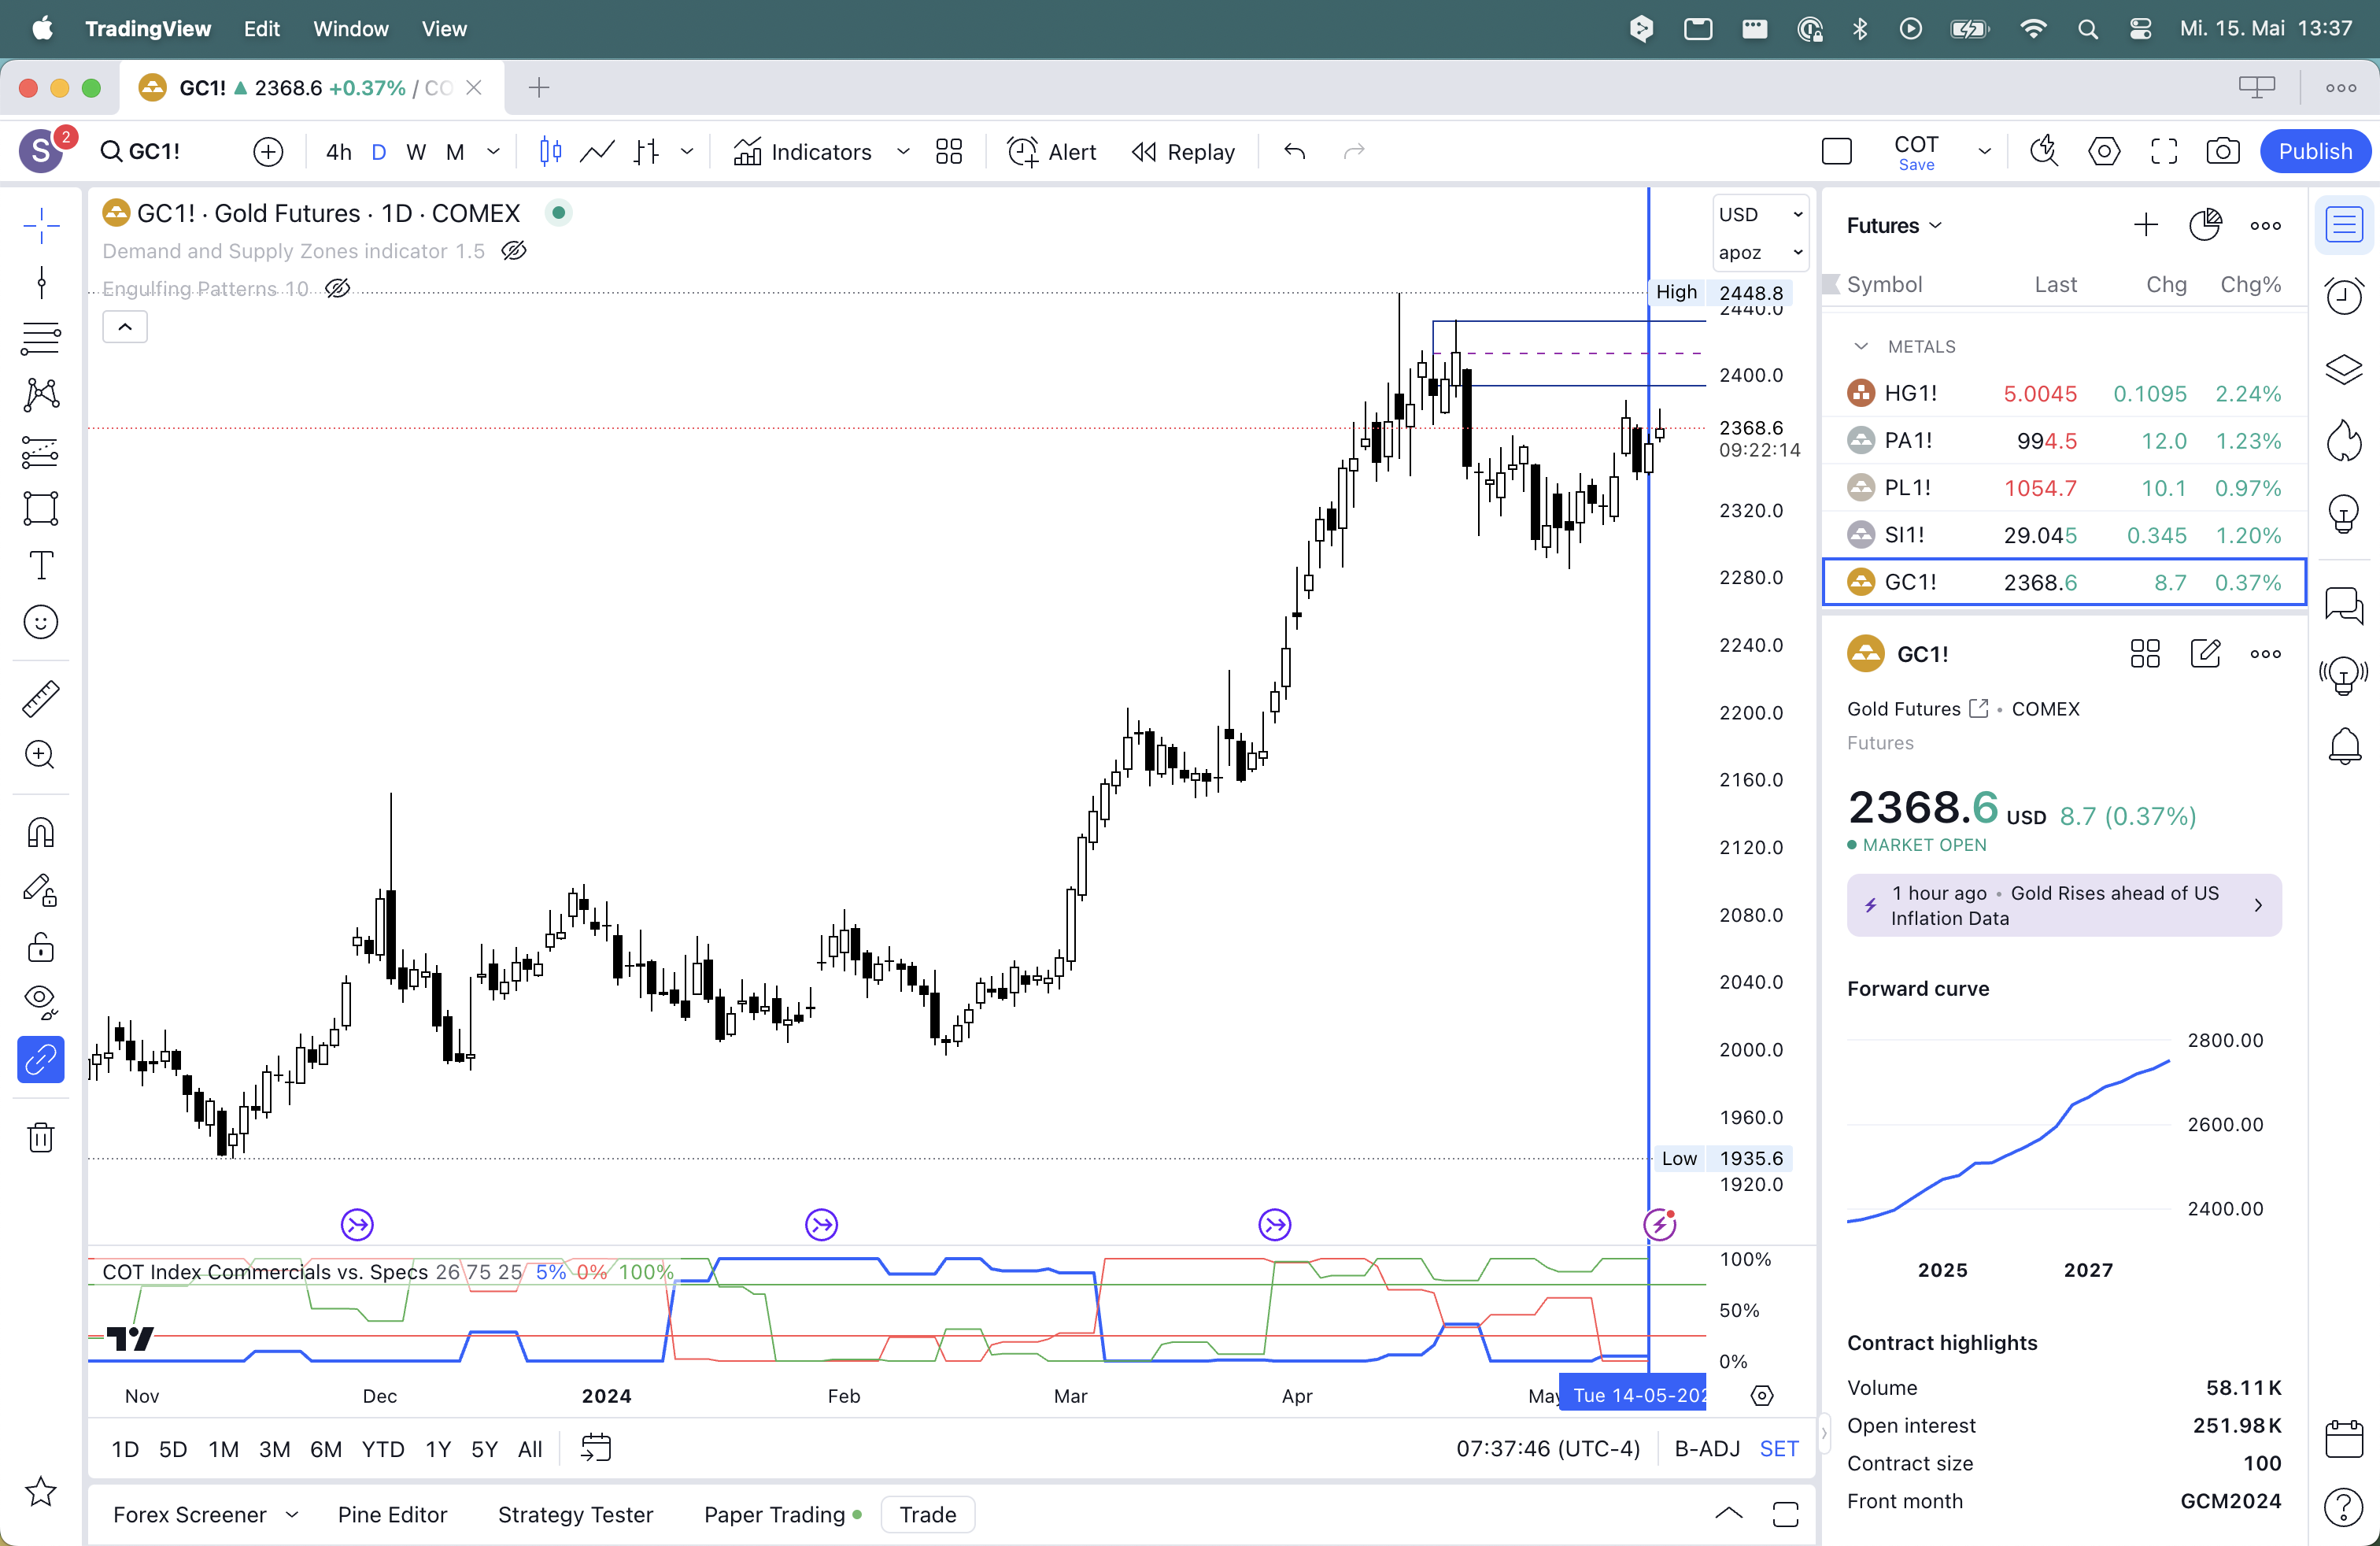
I am following the commercials which read 10%, so my bias is bearish. On the daily timeframe I am now looking for a short setup using supply and demand zones. The horizontal box from 2341.2 to 2392.9 shows a possible supply zone. If the price enters this zone, I would look for a price action reversal pattern such as a pin bar or an inside bar pattern.
This is just an example! It is not a full trading strategy!
Disclaimer: All information provided on this blog is for educational purposes only in relation to trading in the financial markets and is not intended in any way to constitute a specific investment advice, business recommendation, analysis of investment opportunities or similar general recommendation regarding the trading of investment instruments. The information on this site is not directed at residents of any country or jurisdiction where such distribution or use would be contrary to local law or regulation.